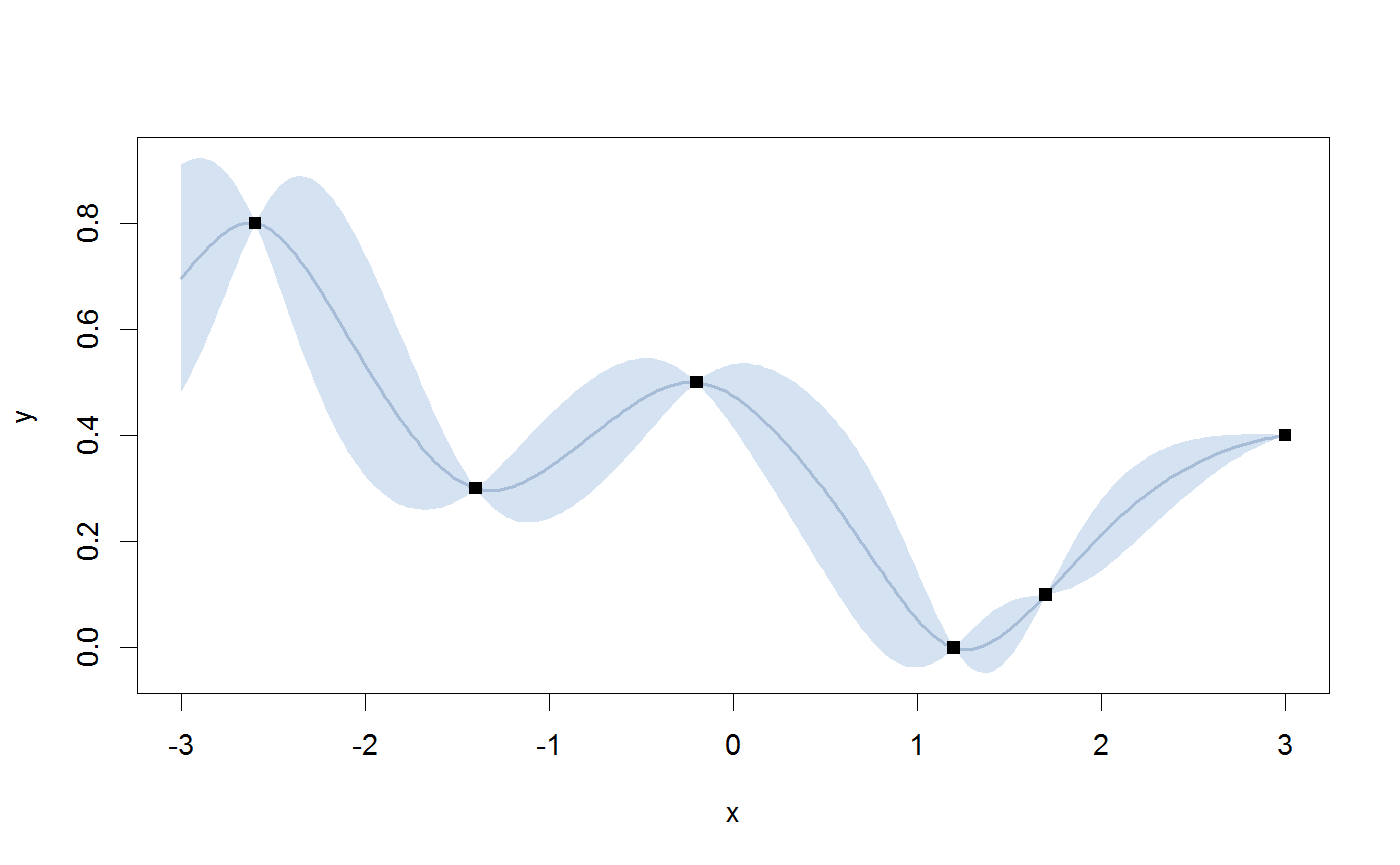
Post Processing and plot of the prediction and the UP variance of a 1 dimension functions.
Post Processing and plot of the prediction and the UP variance of a 1 dimension functions.
plotUP1D(xverif, uppred, x = NULL, y = NULL)
Arguments
| xverif | verification points in 1 dimension. |
|---|---|
| uppred | UP prediction of xverif. |
| x | design points inputs. |
| y | design points outputs. |
Value
Plot the predictions.
Examples
library(UP)
x           <- as.matrix(c(-2.6,-0.2, 1.7,-1.4,1.2,3))
y           <- c(0.8, 0.5, 0.1, 0.3, 0, 0.4)
xverif      <- seq(-3, 3, length.out =300)
krig        <- krigingsm$new()
resampling  <- UPClass$new(x, y, Scale =TRUE)
upsm        <- UPSM$new(sm= krig, UP= resampling)
prediction  <- upsm$uppredict(xverif)
plotUP1D(xverif, prediction, x, y)